AUD/JPY Price Forecast: Moves above 94.50, resistance appears near three-month highs
- AUD/JPY may target the three-month high of 95.65.
- Bullish bias prevails as the 14-day RSI remains above the 50 mark.
- The primary support appears at the nine-day EMA of 93.96.
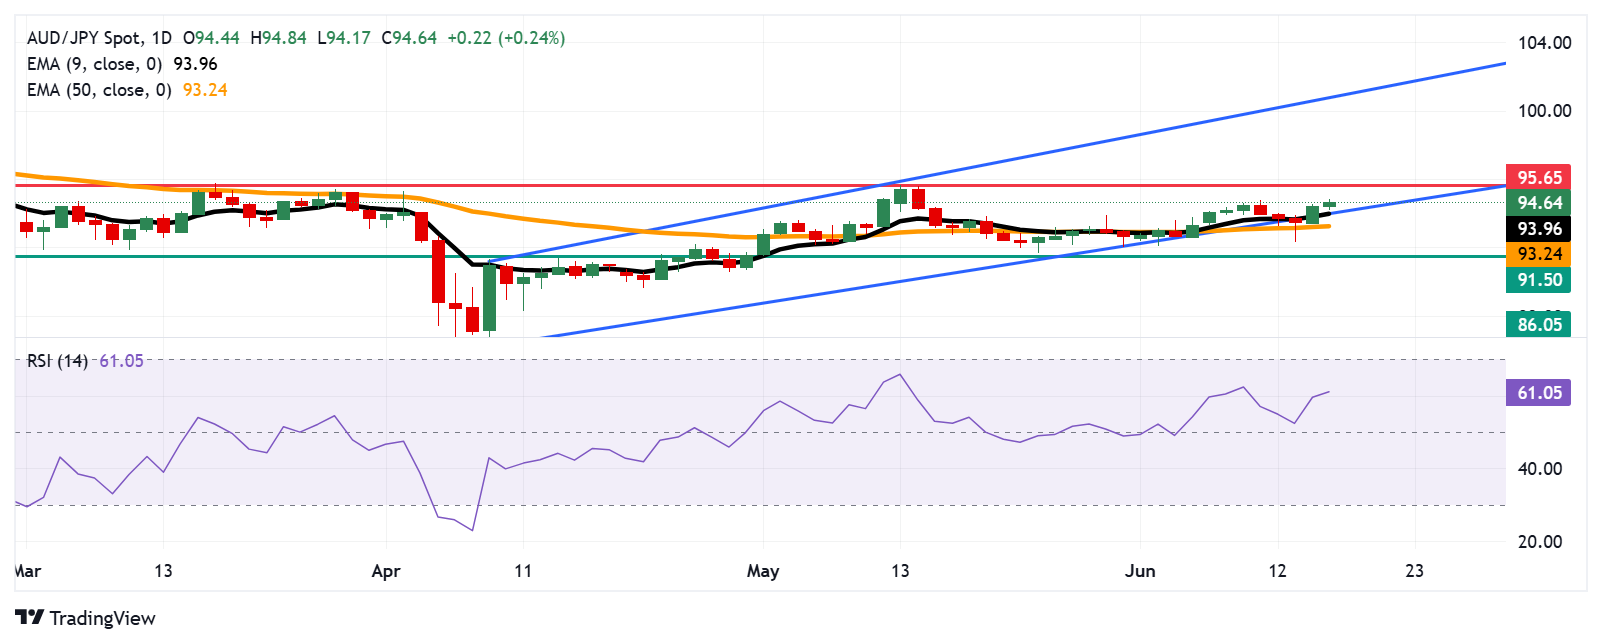
AUD/JPY extends its gains for the second consecutive day, trading around 94.60 during the European hours on Tuesday. As per the technical analysis of the daily chart, the currency cross remains within an ascending channel pattern, confirming a sustained bullish bias.
The 14-day Relative Strength Index (RSI) is positioned above the 50 level, strengthening the bullish bias. Additionally, the AUD/JPY cross rebounds above the nine-day Exponential Moving Average (EMA), indicating short-term price momentum remains stronger.
On the upside, the AUD/JPY cross could approach the three-month high at 95.65, which was marked on May 13. A successful breach above this level could strengthen the bullish sentiment and support the pair to explore the region around the upper boundary of the ascending channel at 101.00.
The AUD/JPY cross may target the primary support at the nine-day EMA of 93.96, aligned with the ascending channel’s lower boundary. A break below this crucial support zone would weaken the bullish bias and prompt the pair to test the 50-day EMA of 93.24, followed by the two-month low at 91.50, recorded on May 1.
AUD/JPY: Daily Chart
Australian Dollar PRICE Today
The table below shows the percentage change of Australian Dollar (AUD) against listed major currencies today. Australian Dollar was the strongest against the British Pound.
| USD | EUR | GBP | JPY | CAD | AUD | NZD | CHF | |
|---|---|---|---|---|---|---|---|---|
| USD | 0.05% | 0.11% | -0.03% | -0.03% | -0.24% | -0.30% | -0.17% | |
| EUR | -0.05% | 0.03% | -0.03% | -0.09% | -0.25% | -0.26% | -0.24% | |
| GBP | -0.11% | -0.03% | -0.14% | -0.13% | -0.28% | -0.34% | -0.27% | |
| JPY | 0.03% | 0.03% | 0.14% | -0.02% | -0.24% | -0.28% | -0.19% | |
| CAD | 0.03% | 0.09% | 0.13% | 0.02% | -0.28% | -0.19% | -0.14% | |
| AUD | 0.24% | 0.25% | 0.28% | 0.24% | 0.28% | -0.03% | 0.01% | |
| NZD | 0.30% | 0.26% | 0.34% | 0.28% | 0.19% | 0.03% | 0.04% | |
| CHF | 0.17% | 0.24% | 0.27% | 0.19% | 0.14% | -0.01% | -0.04% |
The heat map shows percentage changes of major currencies against each other. The base currency is picked from the left column, while the quote currency is picked from the top row. For example, if you pick the Australian Dollar from the left column and move along the horizontal line to the US Dollar, the percentage change displayed in the box will represent AUD (base)/USD (quote).
 Copy Link
 Share on Facebook
 Share on X
 Share by Email